

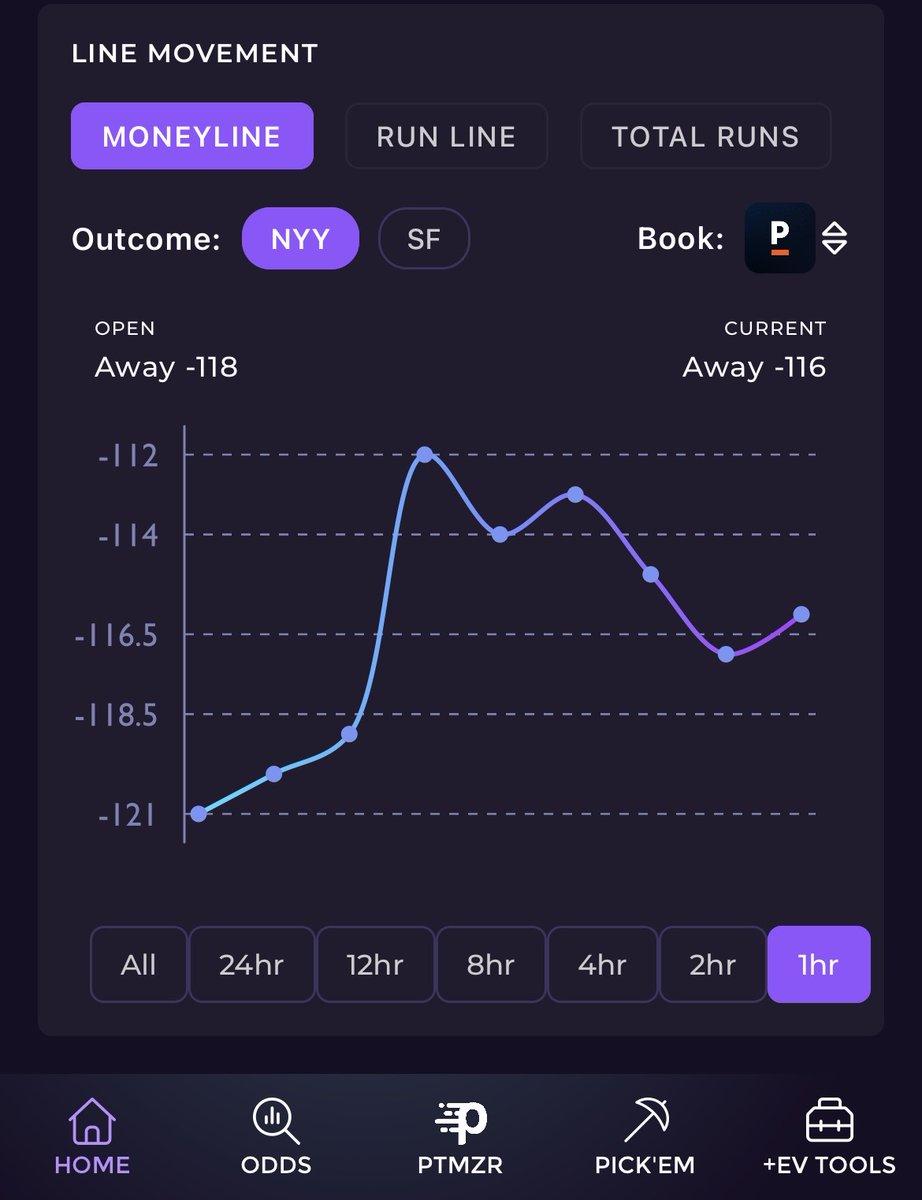
Odds rarely remain fixed from the moment a betting market opens until an event begins. Prices can move as new information appears, market activity changes or an event develops in real time. For years, however, many betting interfaces showed users little more than the latest number, leaving the earlier movement almost invisible.
That approach is changing. Modern betting platforms are increasingly presenting odds as information that develops over time rather than as a static figure. Small arrows, previous-price indicators, movement histories and clearer market updates are appearing across betting interfaces, giving users more context about what has happened before they reach the current price.
A single price tells only part of the story
Consider a market that opens at 2.40 and later moves to 2.05. Someone arriving at the market at 2.05 can see the current odds, but without additional information there is no obvious indication that the price has changed significantly.
That missing context matters because movement itself can be useful information. It does not reveal what will happen in the event, nor does it automatically identify a better bet, but it tells users that the market has changed.
A clearer interface might show:
| Market information | Basic interface | More transparent interface |
|---|---|---|
| Current odds | 2.05 | 2.05 |
| Previous odds | Not shown | 2.40 |
| Direction | Not shown | ↓ |
| Time of change | Not shown | Displayed |
| Price history | Usually unavailable | Available on selected markets |
The difference is not necessarily more data. It is better context around data that already exists.
Why odds move in the first place
Betting prices can change for many reasons, and the explanation varies considerably between sports and markets. Team announcements, player availability, weather conditions and other new information may affect expectations before an event. During live competition, the score, remaining time and momentum of play can produce much faster changes.
Market activity can also contribute. Operators continuously manage prices as information and betting activity develop, meaning the number displayed in the morning may look quite different several hours later.
Common influences include:
- team or player news;
- injuries and late withdrawals;
- confirmed starting line-ups;
- weather and playing conditions;
- changes during live events;
- significant market activity;
- adjustments elsewhere in the betting market.
This is why an odds movement indicator should be treated as historical context rather than a prediction tool. A falling price shows that the number has shortened. It does not prove that the associated outcome has become certain.
Small visual signals are replacing guesswork
One of the biggest changes is surprisingly simple: platforms no longer need complicated charts to communicate movement effectively. A green or upward indicator may show that a price has increased, while a downward marker can highlight shortening odds. Some interfaces briefly retain the previous price beside the new one. Others allow users to open a small history panel and inspect several earlier values.
These features reduce the need to remember what a market looked like during a previous visit. That becomes particularly useful when someone follows several matches or markets at once, because even an experienced user is unlikely to remember dozens of individual prices. The strongest designs keep these signals subtle. Odds remain the primary information, while movement indicators provide a second layer for users who want it.
Historical pricing adds context before an event
Odds history is particularly interesting in pre-match markets because changes can happen over hours or days rather than seconds. Imagine that a cricket market opens with one side priced at 2.20. The price later moves through 2.10, 1.98 and eventually 1.90. Showing that sequence immediately communicates something a standalone 1.90 cannot: the current market looks materially different from the opening market.
This type of history can help users answer practical questions. Has the price been relatively stable? Did it change sharply at one point? Has it moved back and forth? Was the latest movement recent?
Platforms do not need to interpret those changes for the user. Simply making the history visible can provide useful context while avoiding the suggestion that past movement guarantees future direction.
Live betting creates a different challenge
Tracking movement becomes more complicated once an event starts. Live odds can update rapidly, especially around decisive moments, so showing every individual adjustment would quickly overwhelm a mobile screen. Instead, platforms have to decide which changes deserve visual attention.
A cricket match provides an obvious example. A wicket, a high-scoring over or a change in the required run rate can alter market prices quickly. If every update produced a large animation or notification, the interface could become distracting precisely when users need to read it quickly.
This creates a design balance between visibility and stability. Useful live-market interfaces tend to emphasize meaningful changes while allowing minor fluctuations to appear without dominating the screen.
Odds movement is not the same as a prediction
This distinction becomes increasingly important as platforms expose more historical information. Seeing a price fall from 3.00 to 2.50 can easily create the impression that an outcome has become “more likely to win.” The market price has changed, but that does not turn the movement itself into a reliable forecast.
Several interpretations may exist for the same movement, and users rarely have complete information about why an operator adjusted a particular market. Treating every shortening price as a signal to follow can therefore create false confidence.
Good interface design can reduce that risk by presenting movement neutrally. The goal should be to answer what changed and when, rather than telling users what the change supposedly means.
Mobile screens make clarity especially important
Desktop platforms have enough space for charts, expanded market panels and detailed histories. Smartphones do not. That constraint is pushing betting interfaces toward compact visual language. Instead of permanently displaying a graph, a mobile platform can show the current odds with a small directional marker and place the detailed history behind a tap.
A useful hierarchy might look like this:
- current price remains immediately visible;
- a small indicator identifies recent movement;
- tapping the market reveals the previous price;
- an optional panel displays a longer history.
This structure keeps routine betting screens clean while preserving additional information for users who actively want to investigate a change.
Price history can make markets easier to compare
Movement tracking becomes even more useful when a platform offers many related markets for the same event. Without historical context, users see a collection of current numbers. With movement indicators, they can also identify which markets have remained stable and which have changed recently.
| Feature | What it helps users understand |
|---|---|
| Previous price | The most recent change |
| Direction indicator | Whether odds shortened or lengthened |
| Timestamp | When the change occurred |
| Mini chart | The broader movement pattern |
| Opening price | Difference between opening and current odds |
| Live update marker | Whether a price has just changed |
None of these features needs to predict an outcome. Their value comes from making the market easier to read.
Transparency is becoming part of betting interface design
Betting platforms have spent years trying to make complex markets fit comfortably onto increasingly small screens. The next stage is not simply displaying more markets but explaining existing information more effectively.
Odds movement tracking fits naturally into that shift. A user who sees only the latest price receives a snapshot. A user who can also see the opening price, previous value and direction of movement receives a short history of the market.
The challenge for platforms is to provide that history without turning every betting screen into a trading terminal. Compact indicators, optional charts and clearly timestamped changes offer a practical middle ground.
As betting interfaces continue to mature, the current number is unlikely to disappear from the center of the experience. What is changing is the amount of context surrounding it. Odds are becoming less like isolated figures and more like values with a visible history—and that can make rapidly changing markets considerably easier to understand.